 Ordinary least squares continues to be the staple estimator for causal inference for good reason. In order to help new and veteran OLS users get a better sense of how it is working I have created a shiny app that allows for instant interactivity returning coefficient estimates and prediction graphs through Shiny's easy to use user interface controls.
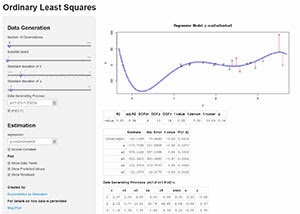
The app only has a single x variable which is randomly drawn from a normal distribution with mean 2 and standard deviation specified by the user. There is also an error term u which has mean 0 and standard deviation specified by the user.
The user also has control of how many observations to generate and how to generate the dependent variable y.
To play around with the app go to: econometricsbysimulation.shinyapps.io/OLS-App/
Source can be found on GitHub: github.com/EconometricsBySimulation/OLS-demo-App/
Thanks for this app. Very nice. Any chance I can get take a look at the source code?
ReplyDeleteI need to think about it.
DeleteHi Francis,
DeleteReally good the app. I'm trying to do something similar with ordinary kriging, so if you decide to share the code please make a new post!
Thanks
Marcos
https://github.com/EconometricsBySimulation/OLS-demo-App
DeleteThis will make a great teaching tool. I can already think of neat ways to expand on it by adding a heteroskedastic and/or autocorrelated error term, lagged regressors, et cetera. You could build a lot of labs out this. Great work!
ReplyDeleteFrancis,
ReplyDeleteMy name is Andy from RStudio. I noticed you had a note on your application about server performance. I am wondering if you would be interested in participating in the alpha of our new hosted Shiny service. You should be able expect better performance, and the traffic generated from your application should be an excellent test for our systems. Let me know if you're interested!
Thanks.
-Andy
Hi Andy,
DeleteThat would be really great! Thanks for the offer. Is there anything you need me to do?
- Francis
Really nice app,
ReplyDeleteand will be very useful for demonstrating model fit. I teach a number of applied statistics courses to graduate students, and this will be very helpful. Thank you so much.
Would love to see this same sort of thing extended to other basic stats taught in applied coursework. For example, how about an ANOVA model, where you could modify variances and distribution shape to demonstrate how an ANOVA model works? Even a simply 1-way ANOVA with the three levels would be fantastic. You could include a typical summary table, with values that change as the user sets different parameters.
Outstanding tool. Keep up the good work!
jeff
Francis,
ReplyDeleteGreat! All you need to do is signup with this form, http://www.rstudio.com/shiny/hosted/sign-up.html and we'll get you setup.
Thanks for your help!
-Andy
This is a best app for OLS users where they can easily estimate and predicts the data through graph. Event app iphone
ReplyDelete