So I have finally gotten beta access to the two most powerful R controlled web application makers in existence and produced very exciting experimental products
A few posts ago I posted a
Visual Reasoning Test that I had made by hand and powered with Concerto. I posted a bit of the Concerto R code in order for people to get a feel for how
Concerto 4.0 beta works. Of those who saw the post, about 300 people chose to start the test. Of those those 300, 60 generous
volunteers completed the entire exam (which took between 20 and 50 minutes depending upon how hard the user was trying).
Since each test is 22 items long, I now have data on about 2000 responses to individual items. This gives me on average about 20 responses per item though some items have substantially more and others less. If you have not taken the opportunity to take this exam, this might be a good chance though I will come back to it with future revisions.
I understand that many a test taker or non-test taker may be curious about the results of this test so I have made an analysis tool using Shiny R. This test tool is a dynamic test tool this allows users to look at the individual items and how the difficulty of those items compares with that of other items.
If you have not yet had the chance to take a look at Shiny R, I suggest you do so. The application, developed by the RStudio team is awesome. Through a handful of commands users are able to create a fully interactive web application leveraging R's power and flexibility.
The dynamic interface that Shiny allows users to design makes high powered analysis easy to systematize and enjoyable.
Concerto takes a bit more work but it also is more flexible. It allows for complex interfaces that users interact with sequentially. Concerto can easily manage keeping track of a user identity system and has database management tools which make it a very attractive option. Combining the two, as I have done, I believe gives developers some serious power to work with.
In this Concerto and Shiny paired application I give the test to the user via Concerto. After the test is done, I make the results of the test in terms of how others did on the items available through Shiny. How this is accomplished is that Concerto saves a copy of the responses in a file in on the concerto server every time a user completes the test. Likewise, every time a user access the Shiny web application, Shiny pulls the latest item response data from the Concerto server.
It then does some basic transformations on that data and then provides the data in various forms through the Shiny generated user interface.
As no doubt is embarrassingly clear, I am very exciting about these new (free!) products entering the market. I will continue to work with both of them. Keep tuned on for future posts.
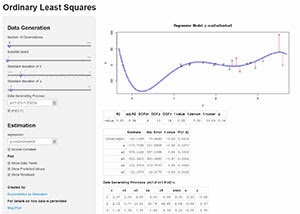 Ordinary least squares continues to be the staple estimator for causal inference for good reason. In order to help new and veteran OLS users get a better sense of how it is working I have created a shiny app that allows for instant interactivity returning coefficient estimates and prediction graphs through Shiny's easy to use user interface controls.


